HOME > Company/Investor Relations > Stocks
Stocks
General Information
General Information
| Stock code | 5805 |
|---|---|
| Stock exchange registration | Tokyo Stock Exchange, Prime Market |
| Business year | From April 1 to March 31 of the next year |
| Year-end dividend record date | March 31 |
| Interim dividend record date | September 30 |
| Annual general meeting of shareholders | Every year in June |
| Number of share constituting one trading unit | 100 shares |
| Number of shares (as of March 31, 2025) |
|
| Number of shareholders (as of March 31, 2025) | 11,745 |
Principal Shareholders (Top 10)
| Name of shareholders | Number of shares held (Thousand shares) |
Percentage of shareholding (%) |
|---|---|---|
| The Master Trust Bank of Japan, Ltd. (trust account) | 4,929 | 16.5 |
| Custody Bank of Japan, Ltd. (trust account) | 2,563 | 8.6 |
| STATE STREET BANK AND TRUST COMPANY 505001 | 2,432 | 8.1 |
| JX Metals Corporation | 979 | 3.2 |
| Fukoku Mutual Life Insurance Company | 892 | 3.0 |
| BNYMSANV RE GCLB RE JP RD LMGC | 687 | 2.3 |
| STATE STREET BANK AND TRUST COMPANY 505103 | 569 | 1.9 |
| J.P. MORGAN BANK LUXEMBOURG S.A. 385598 | 522 | 1.7 |
| CEPLUX-COLUMBIA THREADNEEDLE (LUX) Ⅰ | 486 | 1.6 |
| JP MORGAN CHASE BANK 385781 | 398 | 1.3 |
* Besides the above, there are 1,129,375 shares of treasury stock held by the Company.
* The percentage of shareholding is calculated after deducting the number of treasury stock from the total number of issued shares.
Shareholder Returns & Dividends
Dividend Policy
Our basic policy for profit distribution is to pay stable and continuous dividends to our shareholders based on a capital policy that takes into consideration not only our earnings situation but also our future business strategy and business development, including various investments for the growth of our group.
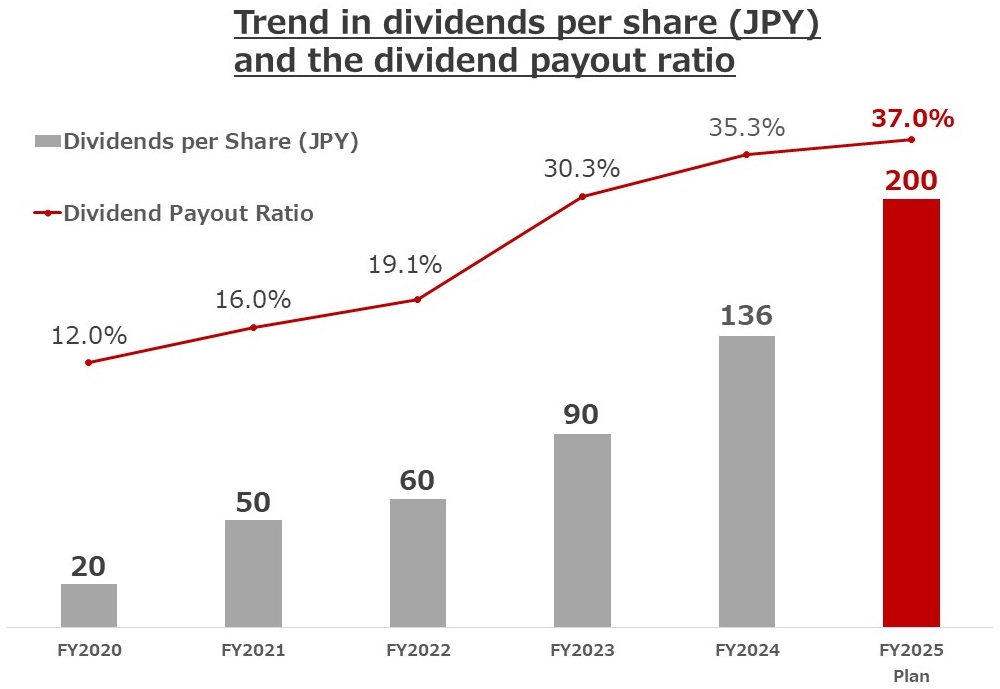
Dividend payout ratio of at least 35% and DOE of at least 4%
Taking into account the situation with accumulating shareholders' equity, we have set a new DOE(dividend payments divided by shareholders' equity) as the minimum threshold for dividends, to ensure that a certain level of return is provided to shareholders even if a downturn in earnings has occurred. We will consider flexible share repurchases, taking into consideration the overall demand for funds for investment in growth and other factors.